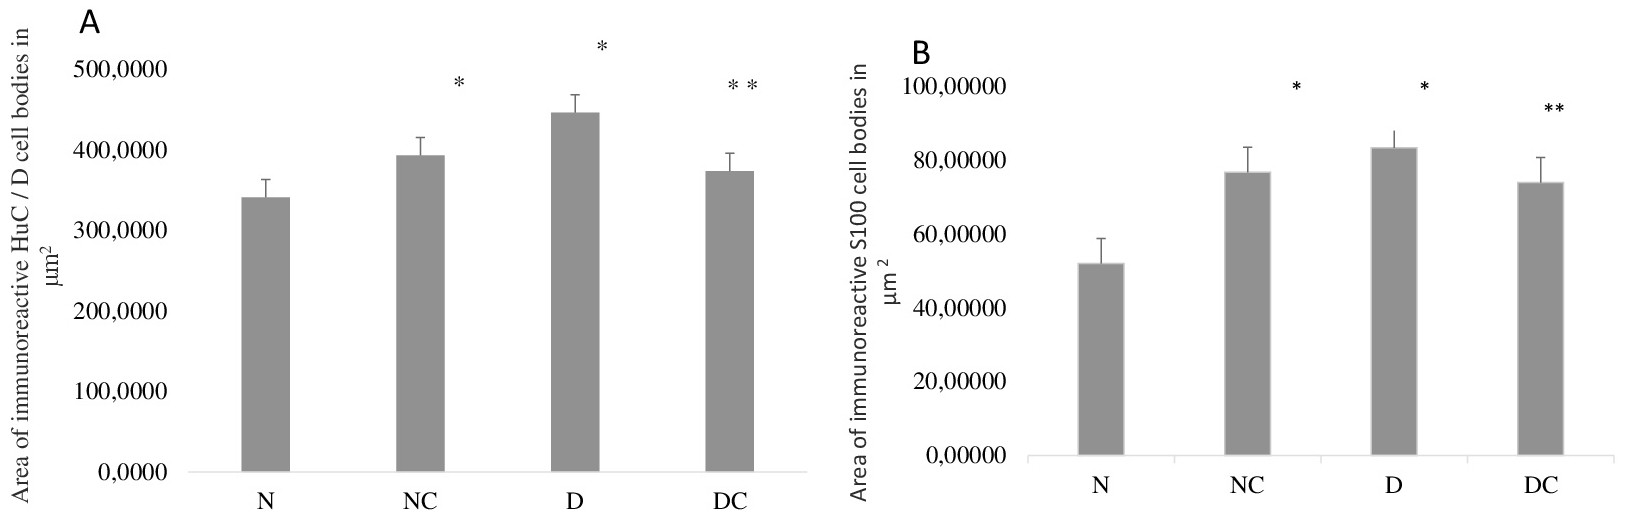
Fig. 2. (A, B) Cell body area (µm2) of HuC/D-immunoreactive myenteric neurons (A) and S-100-immunoreactive enteric glial cells (B) in the jejunum in the N, NC, D, and DC groups. The results are expressed as the mean ± SEM. n = 6 rats/group. *p<0.00001, compared with the N group; **p<0.00001, compared with the D group.